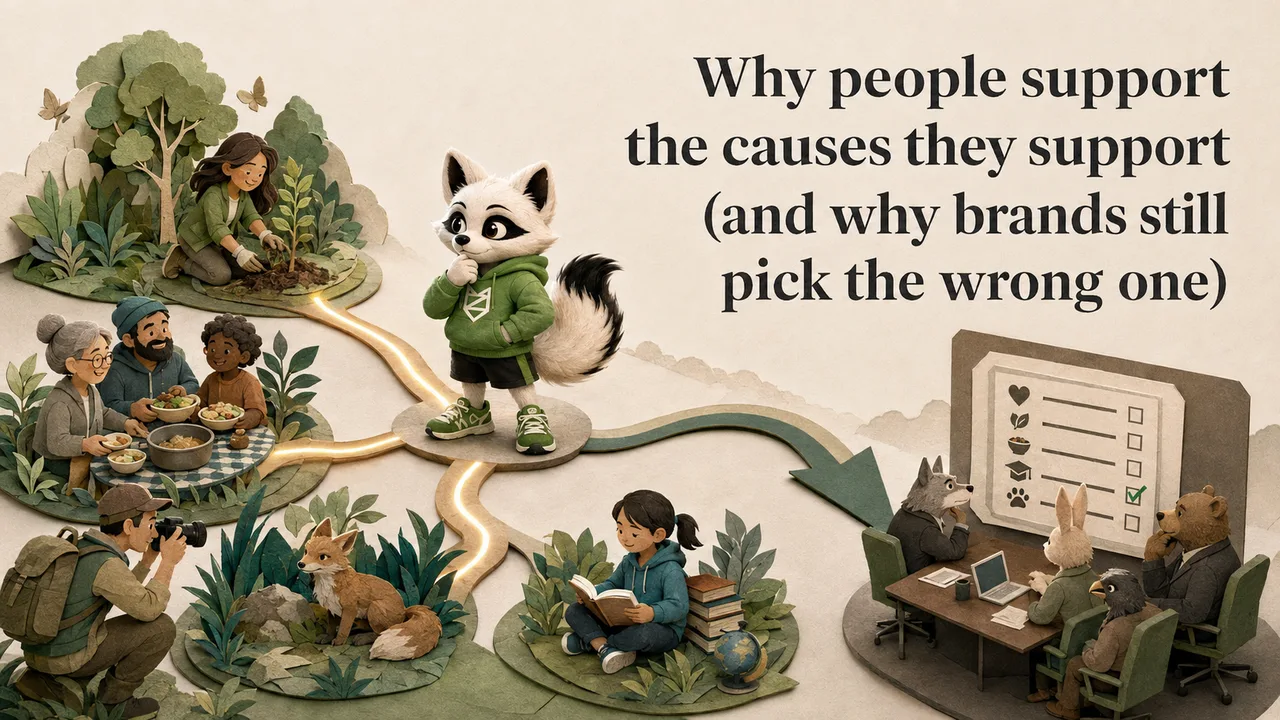
A 2026 giving map for brands and sports organisations using purpose incentives. People already have causes. Most purpose briefs still pick from the boardroom.
People already have a cause. Brands still brief “a purpose campaign”.
That gap is why so many purpose incentives fail to travel. The Charities Aid Foundation World Giving Report 2026, drawn from more than 60,000 people across 105 countries, finds 61% of people donated last year — down from 64% in 2024. The named causes at the top are religion (31%), children and young people (29%) and poverty relief (29%). Local charities (56%) beat those working across many countries (22%). Those are not the lanes most ESG slides open with.
This journal is published by Zenko Protocol, an engagement-and-impact platform. This page is a map, not a product tour. It is the hub for a cluster on the causes people actually choose. It does not replace the five cause lanes people can choose.
What follows is a 2026 reading of global, UK and US giving: why people pick a cause, why nearby proof lifts the gift, why climate concern is not climate money, and how that sits against five live marketplace lanes. One confirmed public programme sits behind this site: 2,000 meals from the MK Dons Shop for Good programme. Named 2025–2026 sources only. No invented rankings.
TL;DR: People already have causes. Brands still pick from the boardroom. CAF’s World Giving Report 2026 finds 61% of people gave last year, with religion (31%), children (29%) and poverty relief (29%) the top named causes, and local charities (56%) beating multi-country ones (22%). In the UK, giving fell to £14bn and 55% of adults (from 69% in 2016); health takes the most money, not the climate slide most purpose decks open with. Seeing local impact is associated with twice the chance of donating and three times the share of income given (WGR 2026). This pillar maps that behaviour onto the five cause lanes already on
/causes/and links out to the cluster. It is not a charity directory and not a guilt appeal.
Table of contents
- People already have causes. Brands still pick from the boardroom
- What people actually funded in 2025 — three maps, not one
- Why people give — care, proof, and the unlock for people who don’t
- Local beats logo-fit — seeing nearby impact changes the gift
- The climate gap — concern is not a donation
- The five lanes people can actually choose here
- How a brand still picks the wrong one (and how to stop)
- What this cluster covers next
- Questions brands keep asking
People already have causes. Brands still pick from the boardroom
Cause choice is already made — by care, proximity and trust — before a brand writes a purpose brief.
Picking the wrong cause, commercially, means the audience will not carry it. They will not talk about it. They will not recognise it as theirs. The brief fitted the logo, or the ESG slide, or the category the board already likes. It did not fit the cause the audience already funds. Low carry is not a creative problem. It is a selection problem.
CAF America, writing from a dual-taxpayer study of US and UK donors, found connection to a cause is near-universal among the donors it asked: 98% of US donors and 97% of UK donors said they are motivated to give when they feel connected to a cause. Convenience and a clear impact story beat guilt. Social pressure is common, but rarely the primary motive — 9% in the UK and 22% in the US. That study is not the 2026 World Giving Report. It is still the cleanest published split on whether shame does the work. It does not.
CAF’s usable line is the right one for this page: not charity driven by guilt. A purpose campaign that asks people to feel worse about themselves is asking them to adopt a cause they did not choose.
The 2025 World Giving Report put the same point in mass-behaviour terms. Most people donate to make a difference to a cause they care about (65%). That is the starting point, not the ask. A later piece in this cluster, How people choose a cause, will stay on motivation. This page stays on the map.
What people actually funded in 2025 — three maps, not one
Global mass behaviour, UK money and US dollars tell different stories. A brand that copies one map onto another will pick the wrong lane.
Do not rank “the world’s favourite cause”. The units are not the same. Global figures below are shares of people. UK figures are pounds. US figures are dollars to recipient types. Hold all three. Flatten none.
Global: what people name
Around the world, 61% of people donated last year, either directly to people in need, to charity, or for religious reasons (CAF World Giving Report 2026, PR 3 June 2026; behaviour in 2025; more than 60,000 people, 105 countries). Religious causes were supported by 31% of people. Children and young people, and poverty relief, were each supported by 29%.
Children and young people are the only cause in every continent’s top five, two years running (29%) — CAF World Giving Report 2025 (21 July 2025), restated in CAF’s 2026 “Why do we give” commentary. That is the one globally portable mass cause. It is also the only lane on this site with confirmed public proof.
People are much more likely to support charities that work locally to them (56%) or nationally in their country (55%) than those working across many countries (22%). Donors in higher-income countries, including in Europe, give a higher share to multi-country charities than donors in lower-income countries. That is a caveat, not a reversal. Local still wins the mass.
UK: where the money went
In the UK the picture is money, not a global headcount. The CAF UK Giving Report 2026 (published 16 March 2026; YouGov Plc fieldwork; N=12,913; calendar 2025) estimates the public donated £14bn, down from £15.4bn. 55% of adults donated or sponsored, against 69% in 2016.
Health took the most money: £2.08bn, and 43% of donors. Children and young people took £1.49bn. Animal welfare took £1bn. Religion took £1.29bn from a small donor set — only 8% of donors, with a far larger average gift (£90 a month). Environment took £658m. Education took £508m. Food banks took £610m (Figure 11).
That is not the climate slide. It is not the global named-cause list either. UK brand taste, measured as consideration rather than pounds, is health again. YouGov’s 2026 Charity Rankings (calendar 2025) put Cancer Research UK, Macmillan Cancer Support and the British Heart Foundation in the top three. Use that to read UK brand affinity. Do not use it as a global giving map, and do not add health or animals as marketplace lanes. They are context. They are not products on the five cause lanes people can choose.
Religion is the largest global named cause. For a secular brand it is a context line, not a sixth lane.
US: where the dollars went
Giving USA 2026 (researched by the Indiana University Lilly Family School of Philanthropy; contemporaneous date 23 June 2026; year 2025) puts US charitable giving at $617.20bn. Religion received $151.58bn. Human services received $99.50bn. Education received $92.01bn. Environment and animals together received $24.57bn — 4% of the total, even with 11% growth.
Education is a serious US dollar lane. It is a weaker UK and global mass-giving lane. A US sports or campus brief that leads on schools is reading a different map from a UK brief that leads on health, and a different map again from a global brief that leads on children and poverty. Copy the wrong map and the audience will not carry the cause.
Why people give — care, proof, and the unlock for people who don’t
Most donors give because they care and want to make a difference. People who are not giving ask first how the money is spent and what result it produces — not for a more emotional film.
The 2025 World Giving Report (21 July 2025; more than 50,000 people, 101 countries) found 65% donate to make a difference to a cause they care about. People said they would be more likely to donate if they had more money themselves (45%), if they knew more about how their money would be spent (36%), and if they knew about the impact the charity might have (35%). That is the live PR wording. Cite it as people.
UK donors say the same thing in a tighter frame. In UK Giving 2026, Figure 8, 78% of donors named at least one emotional reason for giving in the last 12 months. 58% said “I care about the cause”. 53% named at least one reason that CAF groups as feeling part of something bigger. An email from a charity is around five times less likely to prompt a donation than word-of-mouth from a friend or family member.
CAF America’s headings-level point sits next to that, not on top of it: convenience and a clear impact story beat guilt. Social pressure is common and still rarely primary.
None of this is a conversion rate. Proof does not magically turn every non-giver into a donor. The unlock, where it exists, is practical: show how money is spent, and show what the act produced. Do not write a more sentimental script over a cause the audience did not pick. How people choose a cause will take the motivation split further. The commercial implication here is simpler. If the brief starts from guilt, it is already late.
Local beats logo-fit — seeing nearby impact changes the gift
People fund what they can see nearby. Multi-country slogans lose to a local, checkable act.
Two local-impact findings get mashed together in decks. They are not the same study, and they do not measure the same thing. Keep them apart.
The World Giving Report 2026 Donor Insights finds that people who recognise the positive impact of charities on local communities are twice as likely to donate, and three times more generous as a share of income. They are also twice as likely to get involved in making positive changes to society. That is a global association between seeing local charity impact and giving more.
Separately, CAF’s UK Local Giving Report 2026 (20 May 2026; Civil Society write-up) finds that people who see a positive local impact donate at all at 64%, against 46% of those who have not seen any impact or think it has been negative. They are twice as likely to donate locally (51% vs 26%) and three times as likely to volunteer (16% vs 5%). That 2× / 3× is donate-locally and volunteer. It is not the World Giving Report’s 2× donate / 3× share of income.
A third WGR 2026 finding is about belonging, not about seeing impact. Countries where more than 80% of people feel a very or fairly strong sense of belonging to their local community give 1.7% of income on average. Countries where less than half feel that belonging give 0.6%. That is a roughly threefold difference in income share. Do not file it under “show them a local video”.
The geography of support is the same direction of travel. Local charities 56%, national 55%, multi-country 22% (WGR 2026).
The only confirmed public programme behind this site is local in that
sense. MK Dons Shop for Good, working with Surplus to Purpose, funded 2,000
meals of fresh fruit and vegetables in Milton Keynes. The club’s 17
July 2026 release is the primary record (MK
Dons). Two on-site sources then disagree on the hub count.
llms.txt (last reviewed 22 July 2026) names four Milton
Keynes hubs. Homepage case-study copy, captured 20 August 2026, says
three schools in the Milton Keynes City area. The sources disagree. This
page does not pick a marketing number.
That 2,000-meal figure is partner evidence of a physical act. It is not an on-chain participation record, and the chain does not become the meal. A later piece, Local vs global: why a shirt in Milton Keynes beat a world-saving slogan, will stay on that distinction. It will not restage the Insights Sport & Community food-poverty playbook.
See the five cause lanes people can choose if the next question is which local act a participant can actually fund from this marketplace.
The climate gap — concern is not a donation
Most people want stronger climate action. Most of them do not give their money to environment or climate causes.
The UNDP / University of Oxford Peoples’ Climate Vote 2024 (20 June 2024; more than 73,000 people, 77 countries) found 80% want governments to take stronger climate action. That is concern, and it is about government, not about a donation.
UK environment giving was £658m in 2025 (CAF UK Giving 2026, Figure 11) — behind health, children, animals, religion, overseas aid, elderly people and several other lanes. The Blue State UK Giving Behaviours Tracker 2026 (fieldwork 30 January–2 February 2026; N=2,136) puts environment and climate at 6% of respondents who donated to that cause in the past 12 months, against 7% in the 2024 column. In the US, environment and animals together were $24.57bn, or 4% of giving, even after 11% growth (Giving USA 2026).
A brand that opens the purpose brief on trees, carbon or oceans is
not “following the science of giving”. Those lanes exist on
/causes/ and a participant can choose them. They are not
the mass-donation leaders. Write the gap. Do not claim this marketplace
solves climate.
Three planned spokes will hold the environment lanes without turning this hub into three essays. Trees, rewilding, and what people think they are funding separates trees from carbon. Carbon offsetting without the greenwash script stays on pledge versus evidence. Oceans and biodiversity: the cause people name, the proof they rarely get stays on a named cause with thin public proof. One sentence each is enough here.
The five lanes people can actually choose here
This site’s cause marketplace has five named lanes. Only one currently carries confirmed public proof.
Participant-chooses-the-cause is on-page product language. It is not
a list of live funded programmes. The partners below are the names on
/causes/ as of the 20 August 2026 site capture. Education
has no named partner. Do not invent one. Do not add health, animals,
religion, refugees or veterans as lanes.
Feed children in food poverty
Surplus to Purpose. UK. The site says a US cause partner is pending.
This is the highest evidence fit, and the only lane with a confirmed
programme: MK Dons Shop for Good, 2,000 meals. Children and young people
are the only globally portable top-five cause (29%). A later piece,
Food poverty and feeding children, will go deeper and will link
the existing MK Dons journal post. It will not retread
/insights/sport-community/.
Reforestation and rewilding
Eden Reforestation. Separate trees from carbon. Do not invent tonnes or trees planted through this marketplace. The climate-concern gap above is the reason this lane can be chosen without being sold as a mass-donation leader. What people think a tree fund buys is the spoke.
Carbon offsetting
Rimba Raya Biodiversity Reserve. YMYL-adjacent. No invented tonnes. A partner’s evidence of a protected reserve is not an on-chain participation record, and a pledge is not evidence. Carbon offsetting without the script is the spoke.
Biodiversity and ocean health
Second Life. A cause people name. Proof they rarely get. Not a global top donation cause. High greenwash risk if the brief treats “oceans” as a logo-fit. Oceans: the cause people name is the spoke.
Education and schools
“Various delivery partners.” No named school partner. Strong US dollars ($92.01bn, Giving USA 2026). Weaker UK and global mass giving (£508m in the UK). No invented attainment figures. Why education still gets support is the spoke.
How a brand still picks the wrong one (and how to stop)
The wrong cause is the one the audience will not recognise as theirs — usually because it was chosen for logo-fit, an ESG slide, or guilt, not for care, locality, and a checkable act.
A short checklist. Not a product demo. Not an integration walkthrough.
- Start from the map the audience actually funds. Use the three maps above. A UK brief that opens on climate is reading concern, not money. A US brief that ignores education is ignoring $92.01bn. A global brief that ignores children and poverty is ignoring the only portable top-five cause.
- Prefer a cause with visible local proof over a multi-country slogan. WGR 2026’s 56% / 22% split and the two local-impact studies all point the same way. Do not mash the 2× / 3× findings into one line.
- Show how money becomes a physical act. Meals delivered through named hubs. A tree programme. A named reserve. Do not claim the chain is the meal. Partner evidence of physical impact is not an on-chain participation record.
- Let the participant choose among the five live lanes. Do not invent a sixth. Health, animals and religion can appear as context from CAF, Giving USA and YouGov. They are not new products on this site.
- One confirmed example beats a deck of unfunded outcomes. The 2,000-meal programme is the public proof. Hub counts still disagree. Do not paper over that.
If the brief cannot survive those five tests, the cause is for the slide, not for the audience.
What this cluster covers next
This page is the hub. The spokes do the deep work. Do not duplicate them.
Planned spokes, working titles only. Slugs stay unassigned until the SEO gate opens.
- How people choose a cause
- Food poverty and feeding children
- Local vs global: why a shirt in Milton Keynes beat a world-saving slogan
- Why education and schools keep getting support
- Trees, rewilding, and what people think they are funding
- Carbon offsetting without the greenwash script
- Oceans and biodiversity: the cause people name, the proof they rarely get
Spoke 2 links the existing MK Dons journal post and does not retread
/insights/sport-community/. That collision rule is the
point of keeping Sport & Community where it is. This cluster is
about choice, maps and lanes — not another food-poverty playbook.
FAQ
Why do people donate to some causes and not others?
Care, proximity, and a belief the gift will do something checkable. 65% donate to make a difference to a cause they care about (WGR 2025). Local charities 56% versus multi-country 22% (WGR 2026). Guilt is a weak primary motive.
Do people give more to local or global causes?
Local and national, by a wide margin — not “everyone is local”. WGR 2026: local 56%, national 55%, multi-country 22%. In the UK, seeing local impact is associated with 64% donating at all against 46% (UK Local Giving 2026). Higher-income countries send a larger share to multi-country charities. That is a caveat, not the mass pattern.
Why don’t climate campaigns convert concern into gifts?
Because concern is not a donation. 80% want stronger government climate action (UNDP 2024). UK environment money is £658m. Blue State puts environment and climate at 6% of respondents. Trees, carbon and oceans can still be chosen here. They are not the mass-giving leaders.
What should a brand do first?
Read the three maps. Pick a lane the audience already carries. Show a physical act. Then see the five cause lanes people can choose. Do not add a sixth lane.
People already chose. The brief should catch up.
People already have a cause. The commercial mistake is substituting an ESG-favourite lane for the one they will carry.
Three maps disagree, and that disagreement is the information. Local, checkable proof is associated with more giving — keep the World Giving Report and UK Local Giving figures apart. Climate concern is not climate money. Five lanes are live on this site. One programme is confirmed: 2,000 meals in Milton Keynes. Partner evidence of that act is not an on-chain record.
See the five cause lanes people can choose, or use Talk to us in the site navigation if the next step is a conversation with Zenko Protocol.
Continue through the Causes People Choose series
- Why people support the causes they support (and why brands still pick the wrong one)
- How people choose a cause
- Food poverty and feeding children
- Local vs global: why a shirt in Milton Keynes beat a world-saving slogan
- Why education and schools keep getting support
- Trees, rewilding, and what people think they are funding
- Carbon offsetting without the greenwash script
- Oceans and biodiversity: the cause people name, the proof they rarely get