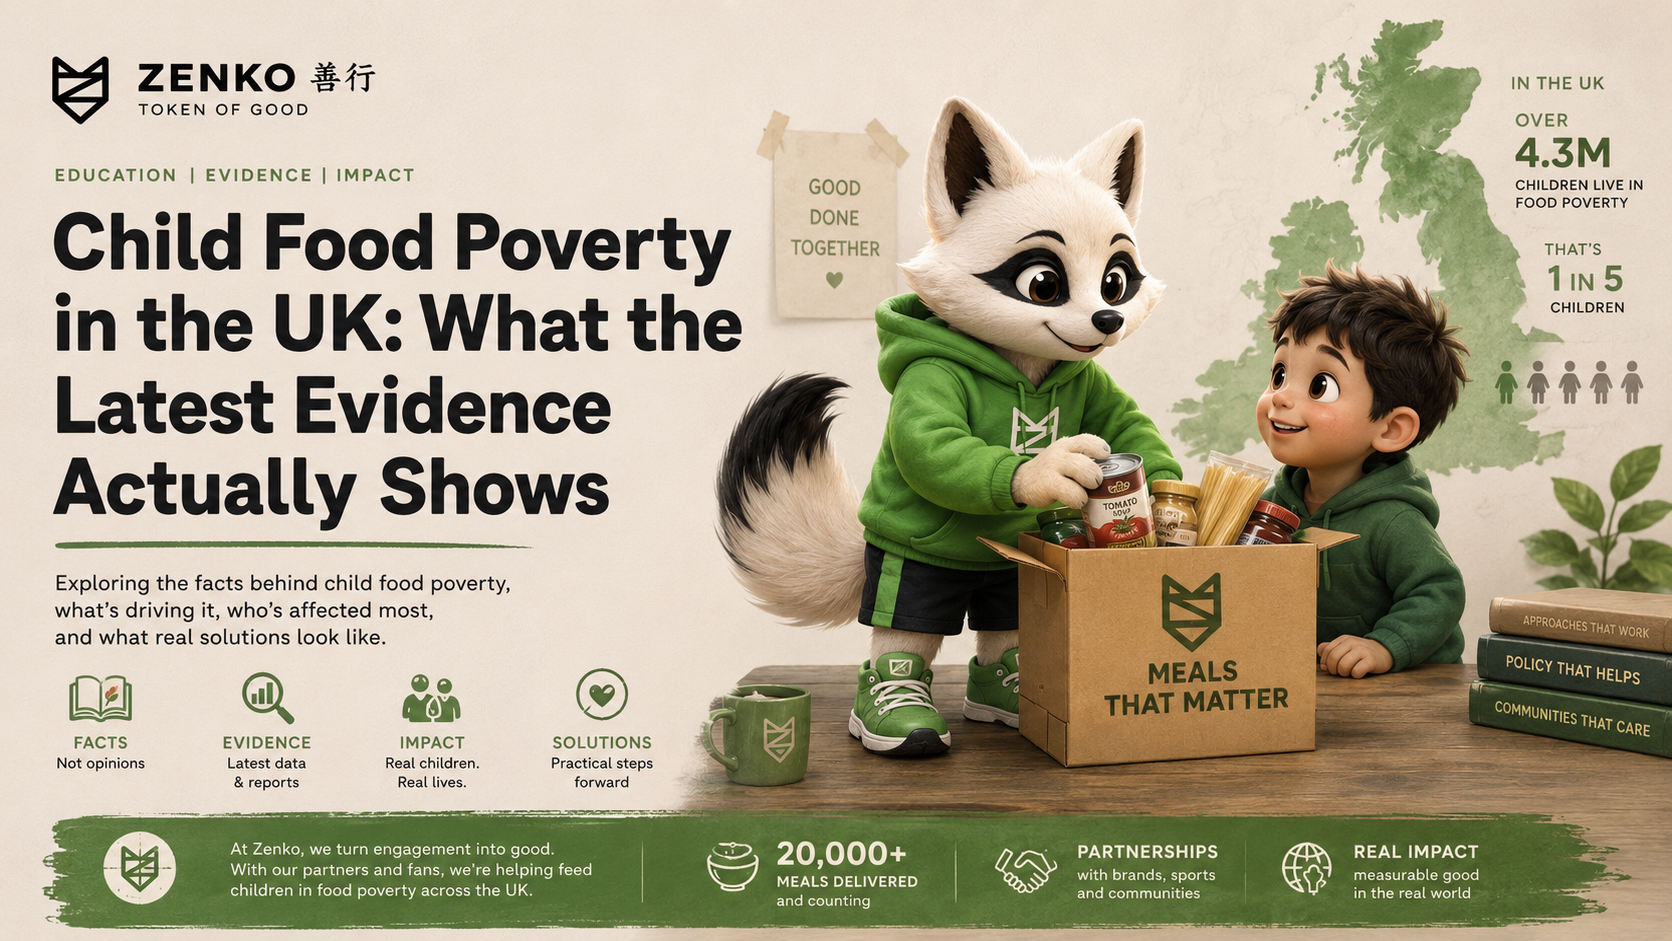
As of the most recent official data, 4.0 million children in the UK were in relative poverty after housing costs in the year to April 2025, and 2.0 million children were in households experiencing food insecurity that same year, down from 2.6 million the year before. These are different measures answering different questions, moving in different directions, and neither should be quoted as if it were the other.
Child poverty, food insecurity and food-bank use are not the same thing
Three separate things get folded into "child hunger" in most casual reporting, and clubs, sponsors and retailers need to keep them apart before building a programme around any of them.
Child poverty is an income measure. The Department for Work and Pensions (DWP) publishes it through the Households Below Average Income (HBAI) series, comparing household income after housing costs against a poverty line set relative to the national median. A household can be in poverty on this measure without ever missing a meal, if it's managing on a very tight budget with no room for anything else.
Food insecurity is a direct behavioural measure: whether a household has, in the recent past, had to eat smaller meals, skip meals, or go a full day without eating because it couldn't afford or access food. DWP measures this annually inside HBAI. The Food Foundation runs a more frequent, smaller YouGov tracker using a similar three-question framework, which moves faster than the annual DWP release but samples fewer households.
Food-bank use is narrower still: who has actually turned to a food bank in the past 12 months. It captures only the sharpest end of hardship, and only people who accessed that specific form of help, DWP's own analysis has previously found that a large majority of people in very low food security did not use a food bank at all, relying instead on family, reduced spending elsewhere, or simply going without.
A club or sponsor citing "child hunger" without specifying which of these three they mean will get challenged by anyone who checks the source, and rightly so.
The current national numbers, and the trend behind them
On income poverty, DWP's Households Below Average Income release, published 26 March 2026, recorded 4.0 million children in relative poverty after housing costs for the year to April 2025 (DWP HBAI; Save the Children UK). This release also marked a methodological change: DWP has moved to administrative-linked data for the major benefits and tax credits from the year to April 2022 onward, replacing self-reported survey income with actual payment records for those elements. Campaigners have broadly welcomed this as an accuracy improvement, since benefit income was previously under-reported in survey responses, but it does mean the series carries a break, figures either side of it aren't directly comparable without adjustment.
Alongside income poverty, 3.5 million children were in material deprivation (unable to afford essential items such as adequate clothing or a warm home), including 1.9 million in deep material poverty, and 72% of children in poverty live in a household with at least one working adult (Action for Children, citing DWP HBAI).
On food insecurity specifically, the trend is genuinely more encouraging than the income figures alone suggest, and worth reporting properly rather than skating past: 2.0 million children (14%) were in food-insecure households in 2024/25, down from 2.6 million (18%) the year before (Action for Children, citing DWP HBAI). This is one measure moving in a better direction while overall child poverty remained broadly flat or high, a reminder that "poverty" and "food insecurity" don't always move together, which is exactly why the two shouldn't be treated as interchangeable in this article or anywhere else.
The Food Foundation's more frequent tracker offers a shorter-term view within that longer trend. Its January 2026 wave found 15% of households with children food insecure, around 2.2 million children, up from 11% in June 2025 (Food Foundation). Its most recent wave, published July 2026, put roughly one in eight UK households food insecure overall, with single-parent households (27.1%), households receiving Universal Credit (35.9%) and households affected by disability (19.2%) all substantially more exposed than average (Food Foundation). The gap between the annual DWP figure and the Food Foundation's rolling tracker is a methodology difference, not a contradiction, different survey designs, different sample sizes, different points in the year.
The food-bank picture, in trend rather than a single number
Trussell's own history gives useful context for how far food-bank demand has grown, and where it's heading now. The charity distributed around 1.1 million emergency food parcels in 2015. That rose steadily through the following decade, spiking through the cost-of-living crisis to a series peak of 3.12 million parcels in 2023/24, before easing back to 2.6 million in 2025 as inflation cooled (House of Commons Library CBP-8585; Trussell end-of-year stats). Of the 2.6 million parcels distributed in 2025, 912,000 went to children. Trussell's network accounts for roughly two-thirds of all emergency food aid distributed in the UK, meaning total food-bank use across all providers, including the independent food banks outside its network, is higher still.
One further finding is worth surfacing on its own: disabled people make up 28% of the UK population but 74% of people referred to Trussell food banks in 2024 (House of Commons Library CBP-8585), a disparity large enough that any local programme design should ask whether it's reaching disabled-headed households specifically, not just households with children in general.
Why employment doesn't automatically remove food insecurity
Seventy-two percent of children in poverty live in a household with at least one working adult. The groups most exposed to food insecurity in the Food Foundation's current tracker, single-parent households, households on Universal Credit, disabled households, include large numbers of working adults whose income still doesn't stretch to consistent food security once housing and other essential costs are paid. This is a structural finding about wages and costs relative to each other, not a claim that any specific employer or sector is responsible.
Policy context worth knowing before you publish anything
The two-child limit on Universal Credit and Child Tax Credit, which restricts means-tested support to a family's first two children, was in place throughout the FYE 2025 reference period covered above, and is being removed from April 2026 (CPAG). The government also published a Child Poverty Strategy in December 2025. Neither change is reflected in the FYE 2025 figures quoted throughout this article, since those figures predate the policy change, worth stating explicitly if you're publishing this content after April 2026, so readers understand the numbers describe the period before the removal took effect.
School-term and holiday pressure
Free school meals are the main formal nutrition safety net during term time in England. In January 2025, around 2.2 million pupils were eligible, 25.7% of state-funded pupils, the highest rate since the current series began in 2006 (House of Commons Library, CBP-9209). Eligibility does not extend to school holidays, when that daily meal support disappears for the same households. Attainment data shows FSM-eligible pupils achieved a GCSE English and Maths standard pass at 43.6%, against 72.3% for other pupils, a 28.7 percentage-point gap. This is a correlation worth taking seriously, not proof that free school meal status alone causes the gap; multiple factors around family income, housing and local school resourcing sit behind both numbers.
What national averages hide
Every figure above is a UK or England average. Regional and local variation is real and substantial, see the next guide in this series for how to pull current, named local-authority data for a specific club, sponsor or retail catchment, rather than assuming the national average applies unchanged.
What organisations can and cannot responsibly claim to solve
No single club, retailer or sponsor programme is going to move a national income-poverty statistic. What a well-run local programme can do is fund and evidence a specific, bounded outcome for a specific group of families, a defined number of meals, delivered through a named local partner, on a specific timeline. That is a real and worthwhile thing to do. It is not the same as reducing child poverty nationally, and claiming otherwise undermines the credibility of the actual work.
Where Zenko fits
Zenko's role in this space is narrow and specific: connecting an existing supporter or customer action to a funded, evidenced local outcome through Shop for Good, and helping the club, sponsor or retailer report that outcome honestly, right down to the specific geography and delivery partner involved. Zenko does not claim to address the causes of child poverty and does not present itself as a charity, the actual delivery of food is always carried out by a named local partner.
FAQs
Is child poverty the same as child food insecurity? No. Child poverty is an income measure comparing household income to a poverty line. Food insecurity is a behavioural measure of whether a household has had to skip or reduce meals due to cost. The two often move together but not always, food insecurity among children actually fell between 2023/24 and 2024/25, even as overall child poverty remained high.
How many children in the UK are food insecure right now? The most recent DWP figure is 2.0 million children (14%) in food-insecure households, for 2024/25, down from 2.6 million (18%) the year before. The Food Foundation's more frequent tracker put households with children at 15% food insecure (around 2.2 million children) in January 2026, a different survey method, so the two figures shouldn't be averaged together.
Why do different organisations publish different child hunger numbers? Because they're measuring different things, on different timescales, using different methods. DWP's HBAI is an annual income and food-insecurity survey. The Food Foundation runs a smaller, more frequent YouGov tracker. Trussell reports food-bank parcels distributed through its own network only, which covers roughly two-thirds of all UK emergency food aid. All three are legitimate; none is wrong, and none should be quoted as if it were one of the others.
Has food bank use in the UK been rising or falling? Both, at different times. Trussell's parcel distribution rose from around 1.1 million in 2015 to a peak of 3.12 million in 2023/24 during the cost-of-living crisis, then eased to 2.6 million in 2025 as inflation cooled. The long-term trend since 2015 is still sharply upward even after the recent easing.
Does having a job protect a family from food insecurity? Not reliably. Seventy-two percent of children in poverty live in a working family, and households with a working adult still appear disproportionately among food-insecure groups, particularly single-parent households and those receiving Universal Credit, because income doesn't always keep pace with housing and living costs.
Sources used
- DWP, Households Below Average Income, FYE 1995 to FYE 2025
- House of Commons Library, Food poverty: Households, food banks and free school meals (CBP-9209)
- House of Commons Library, Food banks in the UK (CBP-8585)
- The Food Foundation, Food Insecurity Tracking
- The Food Foundation, Food insecurity affecting one in eight households in the UK
- Save the Children UK, New data shows 4m children in poverty
- Action for Children, Where is child poverty increasing in the UK?
- CPAG, New data shows 4 million children in poverty
- Trussell, End of year food bank stats
Next step: if you're a club, sponsor or retailer trying to work out what this means for your own community, start with the local evidence checklist or read the full re:Hunger playbook.